By Dr. Klaus L.E. Kaiser ——Bio and Archives--February 4, 2014
Global Warming-Energy-Environment | CFP Comments | Reader Friendly | Subscribe | Email Us
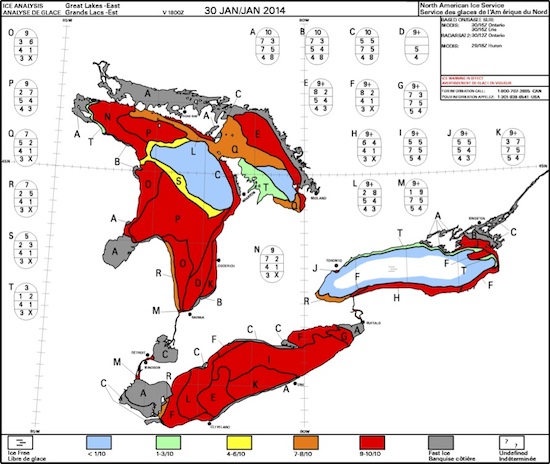
 While the colors in this graph indicate the major sub-areas and their ice cover are easy to read, the numerous "eggs" spread along the sides give detailed information on the exact state of the ice in each area. They provide more in-depth information on the details of ice strength and cohesion. The grey areas indicate "fast ice" that is a solid uninterrupted ice cover attached to land.
The Egg Code
The egg code is a standardized representation of the ice in various parts of the Great Lakes as well as sea-ice in the Arctic and Antarctic, though it is somewhat different for the sea-ice. Let's look at one closer, for example the egg "O" found at the top left corner of the chart. It occurs twice on the chart showing that the ice properties are similar in both areas of Lake Huron. It is enlarged below.
 All numbers indicate values between zero (minimum) and 10 (maximum). In the specific egg shown, the top numeral (9) relates to the total coverage which is also apparent from the code for the red color on the chart. The "9" means that the coverage is 9/10ths of the lake's surface in the areas denoted by the letter "O." The row below the "9" contains two numbers, referring to the concentration in tenths of thick (first digit) and thin ice in the area. Together they add up to the top number. The third row describes the stage of development with the numeral 4 indicating ice of 5-15 cm thickness and the 1 ice of up to 5 cm thickness. The fourth row indicates the size of common ice floes with the first (first digit) indicating the size of large parcels and the second the size of small ones. In that row the 3 is indicating ice floes in the 20-100 m and size range and the X pancake sized ice parcels.
As a rule of thumb, the higher the numbers in any field, the thicker is the ice, the larger are the floes and the stronger and more cohesive is the ice cover. More detailed information is available from NOAA.
If you plan to venture out on the ice anywhere in the areas covered by the daily ice charts, it may be useful to have a look the appropriate "egg" beforehand, but if you just want to stay in the kitchen it suffices to prepare the eggs to your culinary satisfaction.
All numbers indicate values between zero (minimum) and 10 (maximum). In the specific egg shown, the top numeral (9) relates to the total coverage which is also apparent from the code for the red color on the chart. The "9" means that the coverage is 9/10ths of the lake's surface in the areas denoted by the letter "O." The row below the "9" contains two numbers, referring to the concentration in tenths of thick (first digit) and thin ice in the area. Together they add up to the top number. The third row describes the stage of development with the numeral 4 indicating ice of 5-15 cm thickness and the 1 ice of up to 5 cm thickness. The fourth row indicates the size of common ice floes with the first (first digit) indicating the size of large parcels and the second the size of small ones. In that row the 3 is indicating ice floes in the 20-100 m and size range and the X pancake sized ice parcels.
As a rule of thumb, the higher the numbers in any field, the thicker is the ice, the larger are the floes and the stronger and more cohesive is the ice cover. More detailed information is available from NOAA.
If you plan to venture out on the ice anywhere in the areas covered by the daily ice charts, it may be useful to have a look the appropriate "egg" beforehand, but if you just want to stay in the kitchen it suffices to prepare the eggs to your culinary satisfaction.View Comments
Dr. Klaus L.E. Kaiser is author of CONVENIENT MYTHS, the green revolution – perceptions, politics, and facts Convenient Myths