Big Government and Lower Economic Growth: An American History
Per capita GDP in the United States is growing at an all-time low

Sierra Rayne , Bio and Archives--November 22, 2013
American Politics, News | Comments | Reader Friendly | Subscribe | Email Us
Between 1800 and 1916, total government expenditures in the United States generally ranged between 2% and 3% of GDP. There were higher peaks for the War of 1812 (5.1%) and the Civil War (13.8%), but in both cases pre-war government spending levels were re-established within about a decade after the end of the conflict. Even after WWI, the wartime peak of government spending (24.2% of GDP) declined rapidly to a slightly higher than historical spending base (3%) by the mid-1920s.
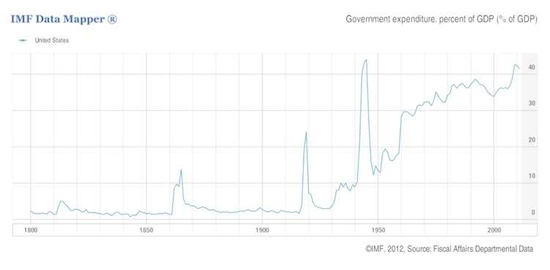
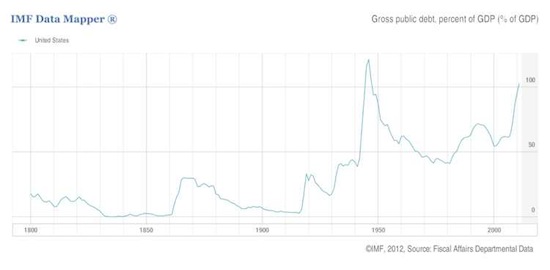
And then in 1930, it began. The long, unrelenting rise in government expenditures up to the current levels of >40% of GDP. Nearly half of the entire American economy has been effectively nationalized. As recently as the early 1950s, government expenditures as a percentage of GDP were more than three-fold lower than at present. The effect of the Korean War is barely noticable in this climb. WWII saw a rapid mobilization/demobilization of the government-based economy, but the pre-1930 low levels of government spending were never to return. Gross public debt tells a similar story. Up to the start of WWI, the inter-war public debt minima were between 0% and 3% of GDP. Debt was accumulated in wartime, and eventually paid off. Much like after the Civil War, the WWI debt was being paid off until 1930, when the era of permanent big government began. After that, the debt increased from 16% of GDP up to its current level of >100%. The WWII peak came and went within a couple decades, but the relentless march of big government precluded any chance of returning to the state of effectively zero public debt that had existed less than only a half-century before.
 What effect has the era of big government had on economic growth? Attempting to definitively isolate government size effects on economic growth is essentially impossible. Econometrics, like all other applications of multiple regression techniques in the social and natural sciences, is highly dependent on what dependent variables are chosen in the regression, which are left out, any time lags between variables, and how correlative-causative relationships are interpreted. But what we can say with certainty is that the era of American big government in the latter half of the 20th century and first part of the 21st century correlates with the lowest period of non-major wartime real per capita economic growth since 1800.
Using historical GDP and population data from Christopher Chantrill's invaluable USGovernmentSpending.com database, along with corresponding consumer price index data from The Federal Reserve Bank of Minneapolis, the following trend of real per capita GDP in constant 2012 dollars can be constructed.
What effect has the era of big government had on economic growth? Attempting to definitively isolate government size effects on economic growth is essentially impossible. Econometrics, like all other applications of multiple regression techniques in the social and natural sciences, is highly dependent on what dependent variables are chosen in the regression, which are left out, any time lags between variables, and how correlative-causative relationships are interpreted. But what we can say with certainty is that the era of American big government in the latter half of the 20th century and first part of the 21st century correlates with the lowest period of non-major wartime real per capita economic growth since 1800.
Using historical GDP and population data from Christopher Chantrill's invaluable USGovernmentSpending.com database, along with corresponding consumer price index data from The Federal Reserve Bank of Minneapolis, the following trend of real per capita GDP in constant 2012 dollars can be constructed.
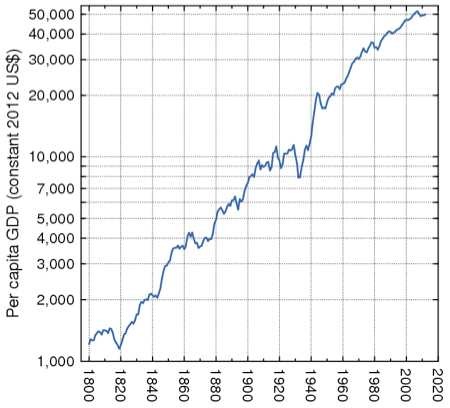 Those with a keen eye will note that between 1800 and the 1920s, although there are clear periods of faster and slower growth, the rate of growth is consistent and undiminishing (i.e., an approximately straight line on a log-linear plot such as this). But once the WWII boom wore off, we find a substantial downward curvature in the growth rate after 1960, coinciding with the era of sustained big government without a major war.
Plotting annual growth in real per capita GDP over time reinforces the case.
Those with a keen eye will note that between 1800 and the 1920s, although there are clear periods of faster and slower growth, the rate of growth is consistent and undiminishing (i.e., an approximately straight line on a log-linear plot such as this). But once the WWII boom wore off, we find a substantial downward curvature in the growth rate after 1960, coinciding with the era of sustained big government without a major war.
Plotting annual growth in real per capita GDP over time reinforces the case.
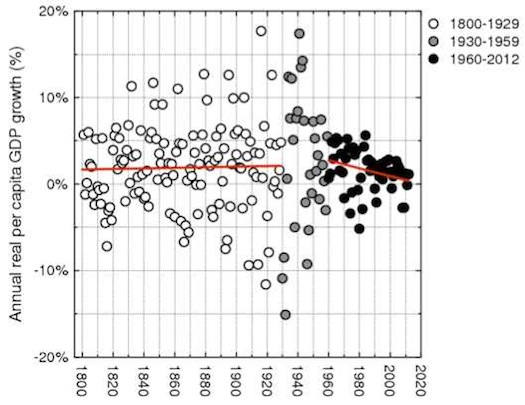 To reiterate, between 1800 and 1929, the USA was a small government nation. While periods of wartime government expansion took place during the War of 1812, the Civil War, and WWI, in each case the pre-war spending levels were re-established in relatively rapid timeframes. The period between 1930 and 1959 represents a complex transition period for government expenditures. The rise of big government began, and was coupled to the extreme economic influence of a truly global war and its geopolitical aftershocks. After 1960, the USA settled into big government, and did not participate in any genuinely major international conflicts that exerted anomalously large effects on government spending patterns.
From 1800 to 1929, there is no significant trend in annual real per capita GDP (p=0.77). But between 1960 and 2012, there is a significant negative trend (p<0.05). The decline is clear and real.
If we consider the running 20-year growth in real per capita GDP, and exclude any 20-year periods that include a major war (e.g., the War of 1812, the Civil War, WWI , WWII, and the Korean War), the dismal nature of the American economy during the last 50 years is even more evident. The 22 worst periods of 20-year growth in real per capita GDP have all occurred since 1985; 31 of the 32 worst periods of 20-year growth have taken place since 1982. Of note, in 23rd worst place is the period from 1866 to 1885, which includes a significant part of the Civil War Reconstruction era. If we remove this 1866-1885 point based on its major war influence, then all of the 31 worst periods of 20-year growth have occurred since 1982.
As generally prosperous as the 20-year period from 1981 through 2000 seemed (incorporating both the Reagan and Clinton booms), this ranks only in the 33rd percentile over American economic history. The USA is in economic decline, and has been declining for over a half-century. This same 50-year period of decline corresponds to the period of largest sustained government expenditures as a percentage of the economy in American history. Coincidence? Not likely.
To reiterate, between 1800 and 1929, the USA was a small government nation. While periods of wartime government expansion took place during the War of 1812, the Civil War, and WWI, in each case the pre-war spending levels were re-established in relatively rapid timeframes. The period between 1930 and 1959 represents a complex transition period for government expenditures. The rise of big government began, and was coupled to the extreme economic influence of a truly global war and its geopolitical aftershocks. After 1960, the USA settled into big government, and did not participate in any genuinely major international conflicts that exerted anomalously large effects on government spending patterns.
From 1800 to 1929, there is no significant trend in annual real per capita GDP (p=0.77). But between 1960 and 2012, there is a significant negative trend (p<0.05). The decline is clear and real.
If we consider the running 20-year growth in real per capita GDP, and exclude any 20-year periods that include a major war (e.g., the War of 1812, the Civil War, WWI , WWII, and the Korean War), the dismal nature of the American economy during the last 50 years is even more evident. The 22 worst periods of 20-year growth in real per capita GDP have all occurred since 1985; 31 of the 32 worst periods of 20-year growth have taken place since 1982. Of note, in 23rd worst place is the period from 1866 to 1885, which includes a significant part of the Civil War Reconstruction era. If we remove this 1866-1885 point based on its major war influence, then all of the 31 worst periods of 20-year growth have occurred since 1982.
As generally prosperous as the 20-year period from 1981 through 2000 seemed (incorporating both the Reagan and Clinton booms), this ranks only in the 33rd percentile over American economic history. The USA is in economic decline, and has been declining for over a half-century. This same 50-year period of decline corresponds to the period of largest sustained government expenditures as a percentage of the economy in American history. Coincidence? Not likely.View Comments
Sierra Rayne——Bio and Archives
Sierra Rayne holds a Ph.D. in Chemistry and writes regularly on environment, energy, and national security topics. He can be found on Twitter at @srayne_ca