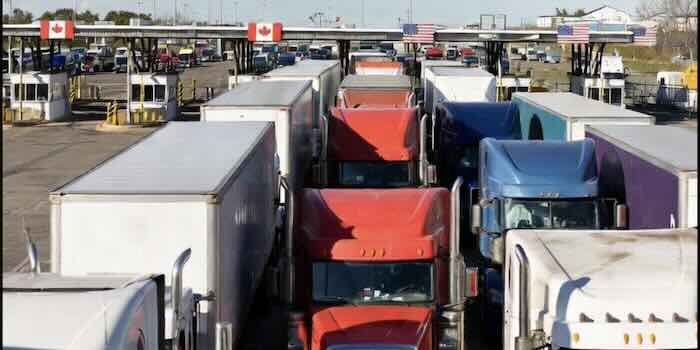
What is the upside of moving to a common market and becoming an energy superpower? There is a host of studies based on the experience of European and other regions entering common markets and the numbers are stunning.[7] As it applies to Canada, a common market would raise long-term GDP by as much as 1-3% especially if free movement of labor were included. This amounts to roughly 34 billion dollars a year or a third of a trillion dollars over ten years. This is hardly chump change. Most importantly, it opens the door to increased capital investment which Canada desperately needs. By the 20th year it would facilitate: A substantial rise in national wealth.
- A shift toward a higher-productivity, higher-income economy
- Stronger global competitiveness
- Dramatic increase Energy production
- A meaningful reduction in poverty[8]
It would also allow for major health care expansion, greater investment in infrastructure (transit, ports, energy grids), education, R & D, housing, and debt reduction.
But the transition will not be without pain. Among the oxen to be gored would be supply management, energy regulations, cultural (CanCon) rules, banking and financial regulations, shipping regulations, and interprovincial trade barriers. Tax rates would also come under pressure to harmonize as labor and capital would be free to pursue opportunities in lower tax constituencies. Military spending would have to increase but that is already underway in Canada. There is no free lunch. Even good things come with a cost.
There is today’s truth turned on its head to get attention. A different way of looking at the problem or should I say opportunity?
Footnotes:
[1] Empirical Economics, 26 Apr 2012 Linking Investment Spikes and Productivity Growth, OECD Economics Department June 2016, Link Between Weak Investment and slowdown in Productivity, Measuring Multifactor Productivity growth, OECD, Oct 2007
[2] Low Interest Rates and Risk‑Taking: Evidence from the U.S. Syndicated Loan Market (Aramonte, Lee & Stebunovs, 2015), Low Interest Rates, Capital Misallocation and Welfare (Dosis, 2025), Wasted cities in urbanizing China, He, G., Mol, A. P. J., & Lu, Y. (2016). Wasted cities in urbanizing China. Environmental Development, 2-13. [18]. DOI: 10.1016/j.envdev.2015.12.003
[3] https://www.rbcbank.com/assets..., OECD Economic Survey Canada 2025, Fraser Institute, July 19, 2014, Canada living standards falling behind rest of developed world,
[4] Buyers Beware: The Cost of Barriers to Building Housing in Canadian Cities (May 2023), Authors: Benjamin Dachis (C.D. Howe)
[5] Veterans Affairs Canada. War Production – Materials for War. Government of Canada.https://veterans.gc.ca/en/reme...
[6] World Bank governance indicators) and concludes that Canada ranks #1 among the world’s top oil-reserve countries in environmental policy, social progress and governance. Large-scale decarbonisation projects in the oil sands. Canada’s Pathway Alliance, six companies representing ~95% of oil sands production – has a public goal of net-zero emissions by 2050 from their operations. Their flagship proposal is one of the world’s largest planned CCS systems a C$16–16.5 billion carbon capture and storage network in northern Alberta, linking 13–20 oil sands facilities via 400+ km of pipeline to a storage hub near Cold Lake. Certainly, in the area of carbon capture Canada is a world leader.
[7] 1. Trade Volumes Increase 20–100%
Studies of common markets consistently find large boosts to bilateral trade:
EU membership increased trade between members by 30–100% (depending on methods).
The EU Single Market program (post-1993) is associated with ~20–30% higher intra-EU trade than would have occurred otherwise.
Trade creation is especially strong when initial tariffs were high.
Why?
Removal of tariffs
Harmonized product standards
Free movement of goods, capital, labor
Lower transaction costs
1. GDP Levels Rise by 1–10% in the Long Run
2. Most cases show modest but meaningful increases in GDP
| Region/Reform | Estimated Long-Run GDP Gain |
|---|
| EU Single Market | 2–4% average, up to 10% for smaller open economies |
| NAFTA (Canada, Mexico, US) | >0.5–2% for the U.S., 2–5% for Mexico, 1–3% for Canada |
| Eastern European states joining EU | 5–15% growth over the first decade |
Core macro-economic studies.
In ’t Veld, J. (2019). Quantifying the Economic Effects of the EU Single Market. European Commission.
Pelkmans, J. (2024). Empowering the Single Market. CEPS.
Micro-economic & trade studies
Cernat, L. et al. (2019). The economic benefits of the EU Single Market in goods. Structural Change and Economic Dynamics.
Welfare gains
Bertelsmann Stiftung (2019). Estimating Economic Benefits of the Single Market for European Welfare.
Regulatory and trade-flow evidence
Kommerskollegium (2015). Economic Effects of the European Single Market.
Productivity & integration
OECD (2025). Economic Survey of the European Union and Euro Area.
Policy-summary evidence
ASMR (2023) – European Commission’s Annual Single Market Report
[8] Madanmohan Ghosh & Someshwar Rao (2004/2005) simulate a Canada–US customs union with harmonized external tariffs and elimination of NAFTA rules of origin, using a dynamic CGE model (GTAP-based).Evangelia Papadaki et al. (Statistics Canada / International Trade Canada) build a CGE model with: 24 sectors, 6 Canadian regions, US, and Rest of World.
Le Monde, EU accession has boosted growth among its new members.
A new report points out that per capita wealth of the 10 countries that joined the European Union in 2004 has risen from 14% to 50% that of Germany in 20 years.
Official Website European Union, 20 years together: Facts and figures about the benefits of the enlargement for the EU