Prices Are Dropping, But Gas Is Still Historically Expensive
EIA, gas prices, gas tax, oil production

Institute for Energy Research , Bio and Archives--December 17, 2014
Global Warming-Energy-Environment | Comments | Reader Friendly | Subscribe | Email Us
The sharp fall in crude oil and gasoline prices since the summer has understandably grabbed the attention of analysts and the general public. Here at IER we’ve covered the topic from the perspective of U.S. output, global supply and demand, and the role of policy from both the Federal Reserve and federal government. Yet despite the sharp relative fall in gasoline prices, it still remains fairly expensive in a historical perspective, as I’ll show in the present post.
Gasoline Prices Do Follow Crude Oil
Before showing the historical charts of gasoline, I want to reassure the reader that gasoline has responded to the recent fall in crude. It’s important to hammer home this point, because whenever oil goes up, the average American is surely going to complain about the corresponding hike at the pump. The following chart from the St. Louis Fed shows that U.S. gasoline prices have fallen along with crude: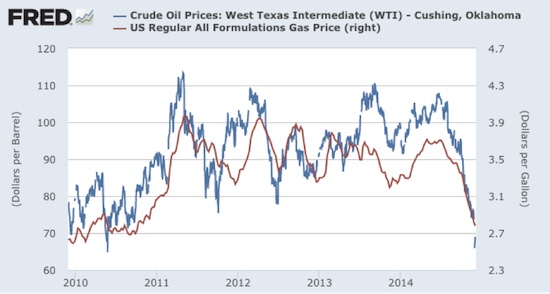 As the chart above indicates, U.S. gasoline prices (red line) have tracked the movements of crude oil (blue line) quite closely since 2010. If anything, gas prices tend not to follow crude all the way up when the blue line spikes.
Still, Gasoline Is Expensive By Historical Standards
Even though American motorists have gotten some respite, let’s not lose perspective. The following chart from the Energy Information Administration (EIA) shows historical gasoline prices, quoted in nominal (red) and inflation-adjusted (blue) terms: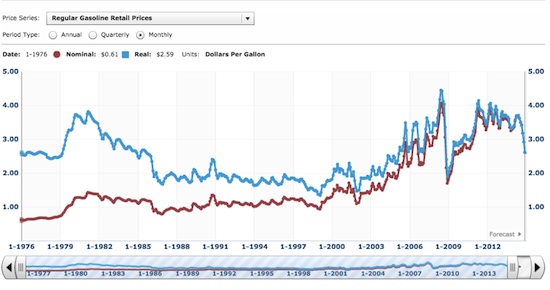 The EIA chart shows a monthly average price of $2.61 in December 2014. Even though this is the cheapest gasoline has been since the financial crash, it’s nonetheless more expensive (in real terms) than gas has typically been since 1976. Specifically, in inflation-adjusted dollars, gasoline was cheaper during the entire period from August 1985 through March 2005 – almost a twenty-year stretch. The only reason gas seems cheap right now is that Americans have endured very high prices, (by historical standards) for the last few years.
Another way of assessing current gasoline prices is to use the Consumer Price Index. The following chart plots the ratio of the gasoline component of the CPI against the CPI itself:
The EIA chart shows a monthly average price of $2.61 in December 2014. Even though this is the cheapest gasoline has been since the financial crash, it’s nonetheless more expensive (in real terms) than gas has typically been since 1976. Specifically, in inflation-adjusted dollars, gasoline was cheaper during the entire period from August 1985 through March 2005 – almost a twenty-year stretch. The only reason gas seems cheap right now is that Americans have endured very high prices, (by historical standards) for the last few years.
Another way of assessing current gasoline prices is to use the Consumer Price Index. The following chart plots the ratio of the gasoline component of the CPI against the CPI itself:
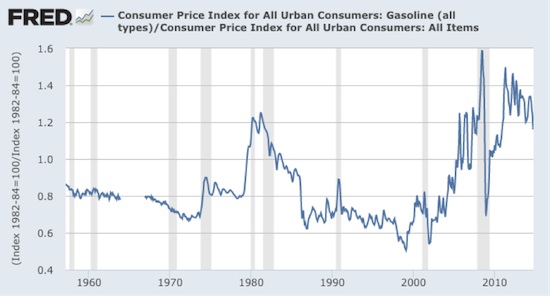 In the graph above, by construction the two indices are calibrated to 100 for the average values in the 1982-84 period, which is why their ratio (by construction) is centered at 1.0 in that time frame. As the graph makes perfectly clear, even with the recent fall, gasoline prices relative to the CPI are still much higher than they have typically been – going back to the 1950s.
Conclusion
It is true that gasoline is much more affordable today than it’s been in five years. Yet that’s hardly consolation in the grand scheme, because the last five years have exhibited the most expensive gas (over such a long period) in at least the last 60 years. The recent plunge in crude oil and gasoline prices should not be interpreted as abnormal, and it certainly shouldn’t be used to justify putting a “floor” under gas prices with a tax.View Comments
Institute for Energy Research——Bio and Archives
The Institute for Energy Research (IER) is a not-for-profit organization that conducts intensive research and analysis on the functions, operations, and government regulation of global energy markets. IER maintains that freely-functioning energy markets provide the most efficient and effective solutions to today’s global energy and environmental challenges and, as such, are critical to the well-being of individuals and society.