The energy sector is one of the largest and most fundamental components of the American economy. For those reasons, the National Climate Assessment's highly climate alarmist section on energy supply and use leaves much to be desired. Interestingly, one of the two lead convening authors for this chapter is from a major fossil fuel company.
The convergence and alignment on climate hysteria between government and the fossil fuel majors is most alarming. One could see these primary energy players not wishing to advocate against the NCA in order to avoid political retribution, but to willingly participate in the creation of these documents is quite another kettle of fish.
According to the NCA, "net electricity use is projected to increase" in the United States during the coming years. That is what the US Energy Information Administration is
projecting, but I certainly don't agree with the US-EIA's methods. Here is the US-EIA's electricity demand growth projection out to 2040. Growth is predicted to remain positive from 2014 to 2040.
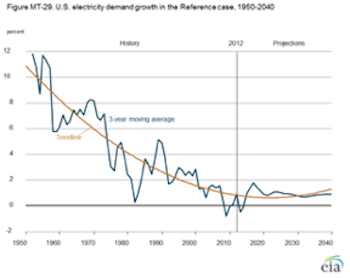
That trendline is one of the worst I've seen yet. A parabolic fit to a dataset that ends in 2013 at the latest? Not likely. If you download the US-EIA's raw data and plot it to the latest actual year possible, a quite different trendline emerges.
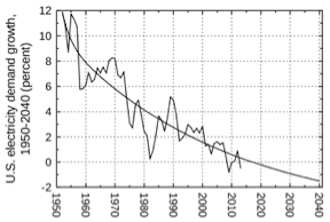
Predicting the future is always perilous, but there is no reason to reject the null hypothesis at this point. Per capita electricity
consumption clearly peaked in 2005 and has declined by almost 3.5 percent since then. The US population annual growth
rate is already down to 0.7 percent, still in steady decline from a value of 1.4 percent during the early 1990s. Peak electricity demand in the US might have been reached during the past few years.
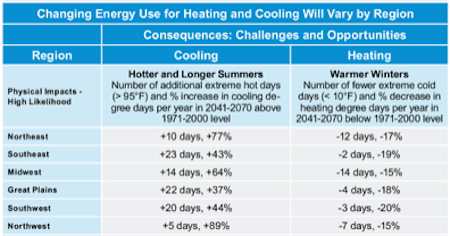
Anthropogenic climate change is -- of course -- a major cause of future increases in electricity demand according to the NCA. The authors state that "the amount of energy needed to cool (or warm) buildings is proportional to cooling (or heating) degree days," and "demands for electricity for cooling are expected to increase in every U.S. region as a result of increases in average temperatures and high temperature extremes. The electrical grid handles virtually the entire cooling load." The NCA's predicted changes in cooling and heating degree days per year are as follows:
Based on my analysis of the NOAA database, here are the trends since 1895 for each of the USA's climate regions.

There is a disconnect between what the NCA is projecting and recent trends in the actual data. While heating degree days in each climate region have declined in the periods since records begin in 1895, and since 1970, there is a uniform absence of any significant trends in heating degree days throughout the nation over the past quarter-century. This suggests that perhaps heating degree days have reached a minimum plateau after declining from the late 1800s up to the 1970s.
When long-term trends stop like this and stabilize for several decades, this is telling us we must be cautious in making future predictions. Perhaps a new long-term equilibrium has been reached, or perhaps the old trend will re-establish itself, or perhaps we're seeing an even longer-term cycle and the trend will now reverse. Who knows. But if heating degree days haven't been declining since at least before 1990, climate models projecting their decline out to the year 2070 should be taken with a grain of salt.
The same reasoning applies for cooling requirements. The Ohio Valley and Upper Midwest climate regions haven't seen any significant trends in their annual cooling degree days since 1895. The Northern Rockies and Plains region hasn't had a significant trend since before the 1970s. And only one-third of all climate regions in the US have had a significant cooling degree day trend since 1990.
Yet look at the NCA's projected increases in cooling degree days over the next several decades. The Northwest, Midwest, Southeast, and Great Plains regions haven't experienced any significant trend in their annual cooling degree days for at least 25 years, but the NCA predicts massive increases (up to 90%) by the 2041-2070 timeframe. I'd red-flag these projections as suspect, and recommend we wait until a new trend establishes itself (if it does) before making any energy infrastructure policy recommendations.
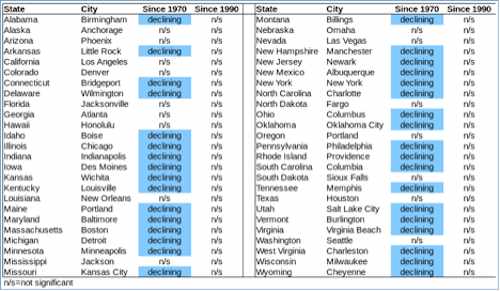
And about those projections for a substantial decrease in the number of extreme cold days (<10°F). If we look for trends in this variable since 1970 and 1990 in the climate sub-regions for the largest city in each state, we find the majority of regions do exhibit a declining trend since 1970, but not a single region has a significant declining trend since 1990 (see table below). Not one. Seems like a potential problem for the NCA's predictions.
The 1970s were undeniably much cooler in the United States than were the 1980s through present. But the warming peaked in the late 1990s. The climate goes through cycles. What the NCA's discussions generally fail to consider is that when we choose a period from 1970 to the present -- and try to extend the trends into the future -- key problems arise.
The first is that the trend from 1970 forward often falls apart if we look at the post-1990 period. It is analogous to looking at monthly temperature trends from February through August in the Northern Hemisphere. The temperature generally increases consistently from February through July, then remains constant (or declines slightly) through August. What happens next? A significant decline through to next January/February and the cycle begins again.
You certainly wouldn't want to project the future based on the February to August trend. And the slowing, and even slight reversal, of the increasing trend from June to August should tell you that there are some fundamental flaws with projecting the trend into the future. Maybe we should heed the same lessons from the 1970 through present climate trends in the United States?
There is good evidence of this in the historical record. Even though many of those cities above show significant declines in the number of extreme cold days since 1970 (but no declines whatsoever since 1990), among these 34 cities with post-1970 trends, only four (Boston, Albuquerque, Oklahoma City, and Cheyenne) have significant trends when we look back all the way to 1895. Only four. That should tell you how non-robust and historically meaningless the NCA extreme cold day predictions are.
Take Colombia, South Carolina as a classic example. It had only 12 days that were <10°F between 1895 and 1969, and then had 13 between 1970 and 1986, and hasn't had any since 1986. So we end up with a negative trend since 1970, but no chance of a trend since 1895. It looks like Colombia just experienced an unusual extreme cold period during the 1970s and first half of the 1980s. To employ this anomalously cool period as a base for climate projections and comparison is, as the warmists like to say, cherry-picking 101.
Look at the same city regions for trends in the number of extreme hot days (>95°F). Only 11 of the 50 climate regions show significant trends since 1970 (and one region has a declining trend), dropping to only 4 of the 50 regions with significant trends after 1990. Denver is the only region with significant trends during both timeframes.
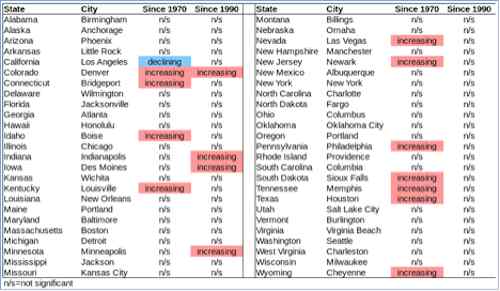
Hardly supportive of the NCA's claims for very large increases in extremely hot days across the United States over the next few decades.
What about this NCA claim?: "Biofuels production in three regions (Midwest, Great Plains, and Southwest) could be affected by the projected decrease in precipitation during the critical growing season in the summer months."
There is absolutely no significant trend in summer precipitation in the American Southwest since 1895 (p=0.69 [parametric] to 0.63 [non-parametric]). The non-significance gets far worse (p=0.91, almost perfect non-correlation) after 1970, and nothing significant after 1990 either. Same lack of significant trends in summer precipitation since 1895, 1970, and 1990 for the Ohio Valley portion of the Midwest. In the Upper Midwest climate region, summer precipitation actually exhibits an increasing -- not decreasing -- trend since 1895, and no significant trends since 1970 or 1990. In the Northern Rockies and Plains climate region, the non-correlation since 1895 is perfect, and there is no significant trend since 1970 or 1990 as well. Nor is there any significant trend for the American South, or the West.
There have been no significant trends in summer precipitation in the Midwest, Great Plains, and Southwest since records begin, nor even on more recent timescales whereby the anthropogenic climate change signature should be most evident, and yet the NCA is concerned about a purportedly likely significant decline in summer precipitation over the next few decades? No evidence appears to exist in the historical record to support the NCA's concerns.
Finally, the NCA presents this table describing the challenges to the American energy system by the late 21st century from anthropogenic climate change.
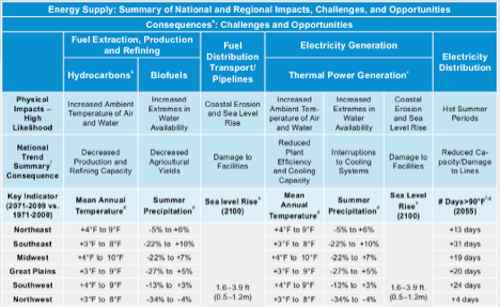
It looks like a problem, until you examine many of the predictions and the historical trends. The projected changes in summer precipitation for all regions of the US except the Northwest involve a range that includes both decreasing and increasing precipitation. So precipitation may go up, or it may go down, or it may not change. Gee, how useful (read: effectively useless) that modeling is. Is the take-home message that we should develop policies to cover all possible scenarios? If so, are we any farther ahead than just licking our finger and sticking it in the air? Probably not.
I already showed above that there are no historical trends in summer precipitation for the Midwest, Great Plains, or Southwest since greenhouse gas concentrations in the atmosphere began increasing even more rapidly about a half-century ago. In the Northeast, summer precipitation has no trend since 1895 or 1970, but since 1990 there is a strong and significant increasing trend -- whereas the NCA is projecting a significant probability of a small decline by the mid-to-late 21st century.
That large decline in summer precipitation predicted for the Northwest? No significant trends in this region since 1895, or 1970, or 1990. No significant trends over any of these timeframes in the Southeast as well. Based on the lack of trends in summer precipitation in any of the sub-regions, you would probably expect there to be no significant trends for the contiguous US as a whole since 1895, 1970, or 1990. And you would be correct. No trends at all. Next topic, please.
As for those mean annual temperature predictions, I have previously
shown that -- with the sole exception of the Northeast -- there have been no significant trends in any of the US climate regions since at least before 1991. The warming has generally stopped over the past two decades. Will it restart to achieve the large projected temperature increases in the NCA? Will the temperature stay approximately constant for the remainder of this century? Will temperatures begin to cycle downwards? Who knows. But at present they have been stable for at least a quarter-century.
Regarding those predictions for a greatly increasing number of days with temperatures above 90°F, here are the trends since 1970 and 1990 in the climate sub-regions for the largest city in each state (see the table below).
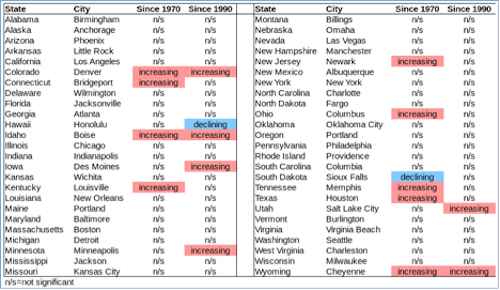
Only 9 out of 50 cities have an increasing trend since 1970, with one declining trend. The other 80% of the cities have no significant trend. Since 1990, only 6 of 50 cities have an increasing trend, with -- once again -- a single decreasing trend. The other 86% of cities have no significant trend. Only three of the cities have significant trends in both time periods. These results should raise even more concerns over the NCA's predictions of a greatly increasing number of days with temperatures above 90°F around the nation by mid-century.
Arguably the energy system risk section of the NCA is one of its most important components. But as shown here, there are large gaps between current and historical trends and what the NCA is projecting. The NCA's entire analysis of the US energy system needs to be re-evaluated. It is unlikely that coherent and responsible energy policy can be founded on many of the NCA's projections.


