The Shale Delusion: Why The Party’s Over For U.S. Tight Oil
For the next year or so, tight oil wells will not be commercial except in the best parts of the best plays. Tight oil companies will lose money. For the most part, the efficiency gains are behind us.

Oilprice.com Art Berman, Bio and Archives--September 17, 2015
Global Warming-Energy-Environment | Comments | Reader Friendly | Subscribe | Email Us
Reports this week from IEA and EIA paint a bleak picture for oil prices as the world production surplus continues. EIA said that U.S. production will fall by 1 million barrels per day over the next year and that, “expected crude oil production declines from May 2015 through mid-2016 are largely attributable to unattractive economic returns.” IEA made the point more strongly. “..the latest price rout could stop US growth in its tracks.” In other words, outside of the very best areas of the Eagle Ford, Bakken and Permian, the tight oil party is over because companies will lose money at forecasted oil prices for the next year.
Global Supply and Demand Fundamentals Continue to Worsen
IEA data shows that the current second-quarter 2015 production surplus of 2.6 million barrels per day is the greatest since the oil-price collapse began in 2014 (Figure 1).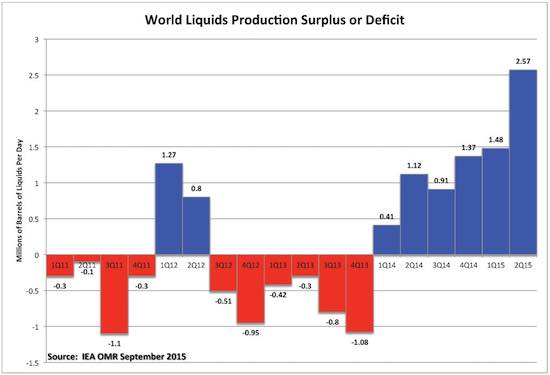 Figure 1. World liquids production surplus or deficit by quarter. Source: IEA and Labyrinth Consulting Services, Inc.
EIA monthly data for August also indicates a 2.6 million barrel per day production surplus, an increase of 270,000 barrels per day compared to July (Figure 2).
Figure 1. World liquids production surplus or deficit by quarter. Source: IEA and Labyrinth Consulting Services, Inc.
EIA monthly data for August also indicates a 2.6 million barrel per day production surplus, an increase of 270,000 barrels per day compared to July (Figure 2).
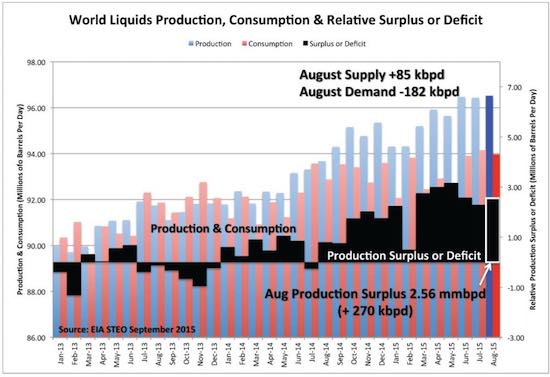 Figure 2. World liquids production, consumption and relative surplus or deficit by month.
Source: EIA and Labyrinth Consulting Services, Inc.
(click image to enlarge)
It further suggests that the August production surplus is because of both a production (supply) increase of 85,000 barrels per day and a consumption (demand) decrease of 182,000 barrels per day compared to July.
The world oil demand growth picture is discouraging despite an increase in U.S. gasoline consumption (Figure 3).
Figure 2. World liquids production, consumption and relative surplus or deficit by month.
Source: EIA and Labyrinth Consulting Services, Inc.
(click image to enlarge)
It further suggests that the August production surplus is because of both a production (supply) increase of 85,000 barrels per day and a consumption (demand) decrease of 182,000 barrels per day compared to July.
The world oil demand growth picture is discouraging despite an increase in U.S. gasoline consumption (Figure 3).
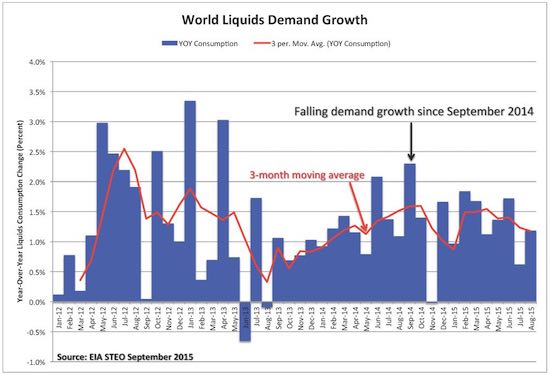 Figure 3. World liquids demand growth. Source: EIA and Labyrinth Consulting Services, Inc.
World liquids year-over-year demand growth has fallen by almost half from 2.3 percent in September 2014 to 1.2 percent in August 2015. This is part of overall weak demand in a global economy that has been severely weakened by debt.
The news from both IEA and EIA is, of course, terrible for those hoping for an increase in oil prices.
U.S. production has fallen 510,000 barrels of crude oil per day since April 2015 while OPEC production has increased 1.2 million barrels per day since the beginning of the year (Figure 4). U.S. production increases in the first quarter of 2015 were partly because of an oil-price rally that ended badly this summer, and because of new projects coming on-line in the Gulf of Mexico.
Figure 3. World liquids demand growth. Source: EIA and Labyrinth Consulting Services, Inc.
World liquids year-over-year demand growth has fallen by almost half from 2.3 percent in September 2014 to 1.2 percent in August 2015. This is part of overall weak demand in a global economy that has been severely weakened by debt.
The news from both IEA and EIA is, of course, terrible for those hoping for an increase in oil prices.
U.S. production has fallen 510,000 barrels of crude oil per day since April 2015 while OPEC production has increased 1.2 million barrels per day since the beginning of the year (Figure 4). U.S. production increases in the first quarter of 2015 were partly because of an oil-price rally that ended badly this summer, and because of new projects coming on-line in the Gulf of Mexico.
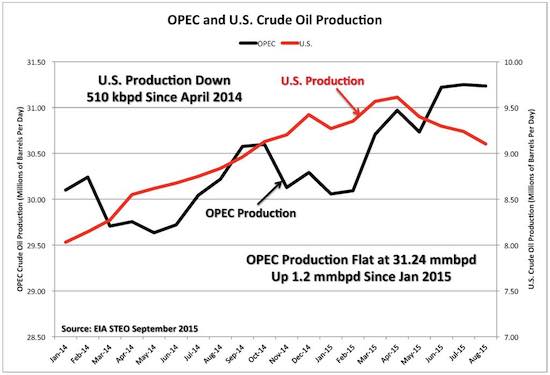 Figure 4. OPEC and U.S. crude oil production. Source: EIA and Labyrinth Consulting Services, Inc.
It appears that OPEC is winning the contest with U.S. tight oil producers to see which can continue to over-produce oil at low prices. IEA ended its September Oil Monthly Report saying,“On the face of it, the Saudi-led OPEC strategy to defend market share regardless of price appears to be having the intended effect of driving out costly, “inefficient” production.”
In other words, tight oil and oil sands production.
With Iran poised in early 2016 to add almost as much oil as the amount of the U.S. production decline to date, the outlook for tight oil producers could not be worse. And yet, the sell-side analysts and investment bank research groups continue to chant the refrain of logic-defying hope for tight oil producers in the face of crushingly low oil prices.
Figure 4. OPEC and U.S. crude oil production. Source: EIA and Labyrinth Consulting Services, Inc.
It appears that OPEC is winning the contest with U.S. tight oil producers to see which can continue to over-produce oil at low prices. IEA ended its September Oil Monthly Report saying,“On the face of it, the Saudi-led OPEC strategy to defend market share regardless of price appears to be having the intended effect of driving out costly, “inefficient” production.”
In other words, tight oil and oil sands production.
With Iran poised in early 2016 to add almost as much oil as the amount of the U.S. production decline to date, the outlook for tight oil producers could not be worse. And yet, the sell-side analysts and investment bank research groups continue to chant the refrain of logic-defying hope for tight oil producers in the face of crushingly low oil prices.
Party On, Dude!
This week, Raymond James joined the chorus with its bewildering “Energy Stat: U.S. Operators’ Response to Low Oil Prices? Get More Efficient!” The message is all about rig productivity and drilling efficiencies. I showed in my post last week that these measures are nothing but red herrings to distract from the unavoidable truth that all tight oil companies are losing money at current oil prices. I would like to say that Raymond James is simply repeating the shop-worn and illogical cliché that “We’re losing money but making it up on volume” but it’s much worse than that. There is no mention of money in the report. There is not a single dollar sign ($) in the text or figures nor are there are there any costs, prices or cash flows mentioned. That seems odd since Raymond James is, after all, a financial advisory company. Raymond James presents 30-day IP (initial production rate) data to show that everything is fine and getting better in the tight oil patch. Really guys? Is that why oil companies are laying off staff, cutting budgets and selling assets? Besides, everyone knows that IPs are a practically meaningless predictor of EUR or profitability, and something that producers often manipulate to create press releases in order to satisfy investors. Nonetheless, they forecast “2015 to be a banner year for both oil/gas well productivity gains.” Interesting but irrelevant since it’s going to be an atrocious year for profits. Here is my table from last week’s post for the best of the tight oil companies in the best parts of the plays.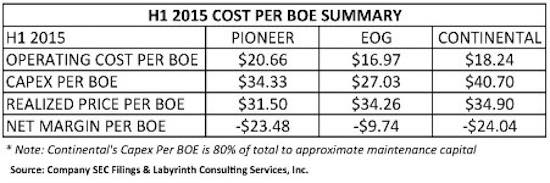 Table 1. First half (H1) 2015 cost per barrel of oil equivalent summary for Pioneer, EOG and Continental.
Source: Company SEC filings and Labyrinth Consulting Services, Inc.
EOG, Pioneer and Continental lost between $10 and $24 per barrel in the first half of 2015 but Raymond James says, “Never mind and party on, Dude!”
This report by Raymond James is both misleading and clearly out-of-touch with the price and investment environment that the International Energy Agency and the Energy Information Administration describe.
Table 1. First half (H1) 2015 cost per barrel of oil equivalent summary for Pioneer, EOG and Continental.
Source: Company SEC filings and Labyrinth Consulting Services, Inc.
EOG, Pioneer and Continental lost between $10 and $24 per barrel in the first half of 2015 but Raymond James says, “Never mind and party on, Dude!”
This report by Raymond James is both misleading and clearly out-of-touch with the price and investment environment that the International Energy Agency and the Energy Information Administration describe.
Conclusions
ExxonMobil CEO Rex Tillerson summarized the situation this week in an interview with Energy Intelligence: “It [tight oil] will compete. Will all of it compete at all pricing? No.” For the next year or so, tight oil wells will not be commercial except in the best parts of the best plays. Tight oil companies will lose money. For the most part, the efficiency gains are behind us. Until market fundamentals of supply and demand come into balance, prices will remain low. Goldman Sachs predicted yesterday that U.S. oil prices through the first quarter of 2016 will be “low enough to discourage investment in new oil production and shrink the global glut of crude.” Clearly for now, the party is over for tight oil. By Art Berman for Oilprice.comView Comments
Oilprice.com is the most popular energy news site in the world. Our analysis focuses on Oil and Gas, Alternative Energy and Geopolitics.
Oilprice works with the largest names in financial news and provides news and analysis to sites such as: CNBC, Yahoo Finance, Nasdaq, Motley Fool, Huffington Post, Christian Science Monitor, Minyanville and hundreds of others.
OilPrice.com publishes more news than any other energy related site online.