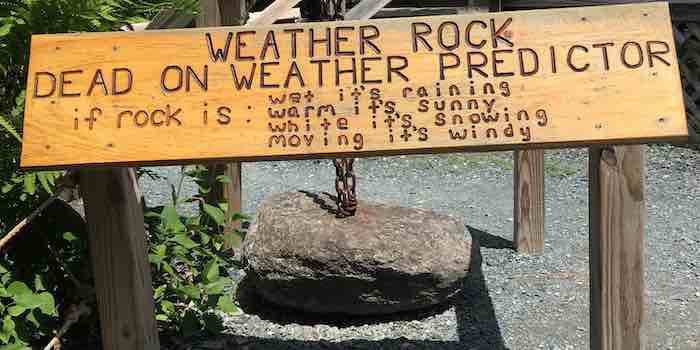
The term “Weather Rocks” brings to mind different things. Some folk may have a “weather rock” just outside, which when it is dry you know it is not raining. When it is black and wet, you know it is and when it is white there is snow.
In getting into climate, weather really rocks, because we see it every day and it all adds up to climate. And the latter has become politicized in an unprecedented attempt to set the temperature of the nearest planet at 277 K. Of course, this has been the greatest audacity in the overly long history of bureaucratic scheming. As if this nonsense wasn’t glaring enough, there is earnest debate about whether it should be at 277.5 or 278.5. The smaller number is used for urgency about “tipping points” whereby all-of-a-sudden, the “Earth is going to fry!”.
Dr. Verner at Hadley in 2010 stated: “Children just aren’t going to know what snow is”
The giveaway to raw political ambition is that it requires huge increases in regulation and taxation to prevent “Frying”. Before getting into the physics of real weather and climate, it is best to compare the hysteria with results.
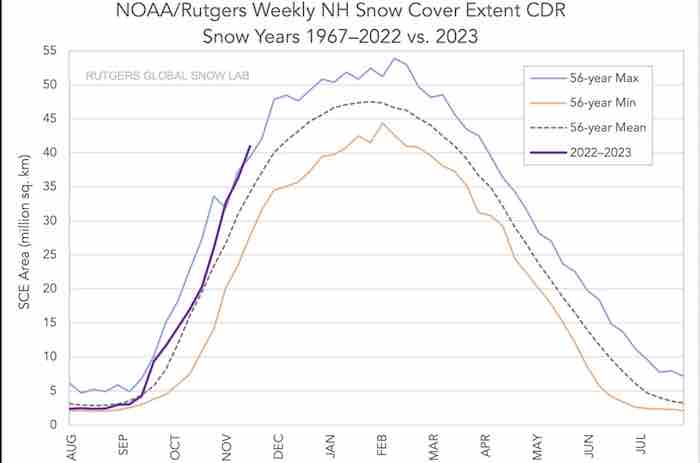
This time of year, snow in the Northern Hemisphere is a seasonal feature. “Global Warmers” have been convinced that snow would become a thing of the past. As the grant-seeker, Dr. Verner at Hadley in 2010 stated: “Children just aren’t going to know what snow is”.
The first chart shows the Rutgers Snow Cover Extent for the Northern Hemisphere:
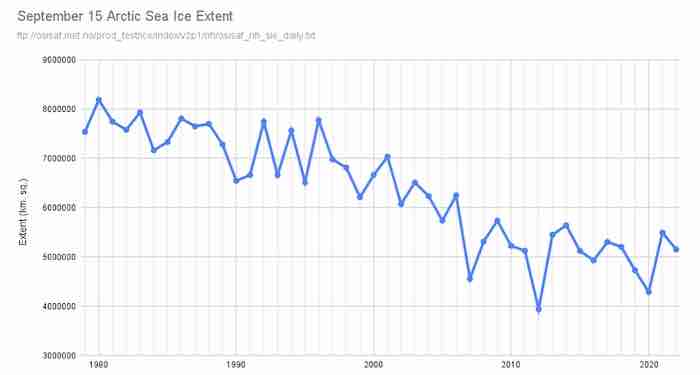
The next chart shows the Arctic Sea Ice Extent for the seasonal low in September. The declining trend since 1980 ended in 2010 and the subsequent increase is interesting:
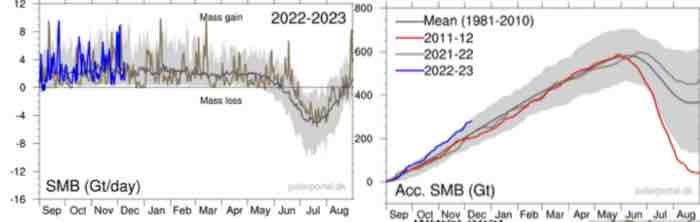
And then there is an October headline from The Guardian: “Major Sea-Level Rise Caused by Melting of Greenland Ice Cap is ‘Now Inevitable’”. The following chart of Greenland’s Surface Mass Balance of ice shows that accumulation for this season is at the high-side of the standard deviation:
Support Canada Free Press
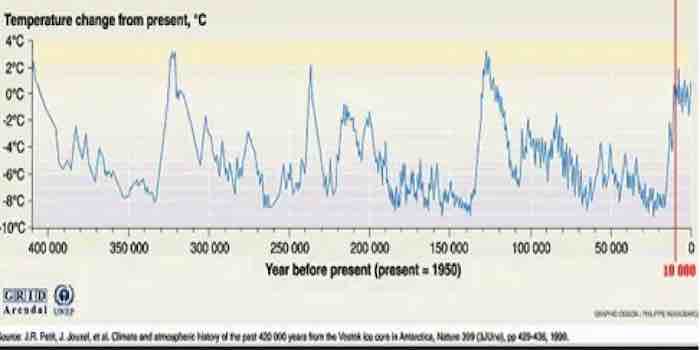
And then there is the Vostok chart of temps in Antarctica over the past 400,000 years. Nothing new going on lately, with a remarkably consistent range between highs and lows. While of Antarctica, the swings in temps from ice age to interglacial would have been similar over the Northern Hemisphere:
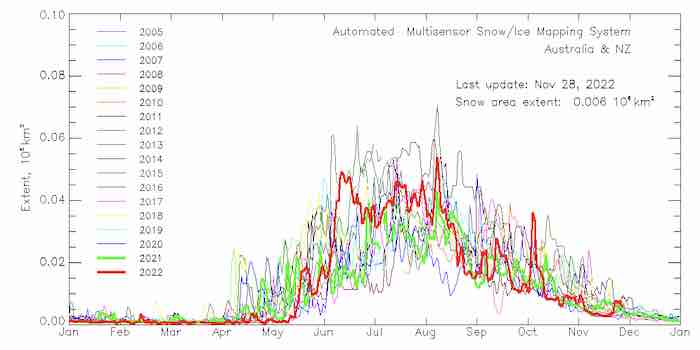
The next chart is of Snow Cover in Australia and NZ from 2005 to date:
And Cap Allon in his Electroverse site posted these headlines on December 9th:
“Australia Set Its Coldest-Ever December (Summer)”“November in the U.S. Was 2 F Below Average, Coldest NW In 4-Decades”
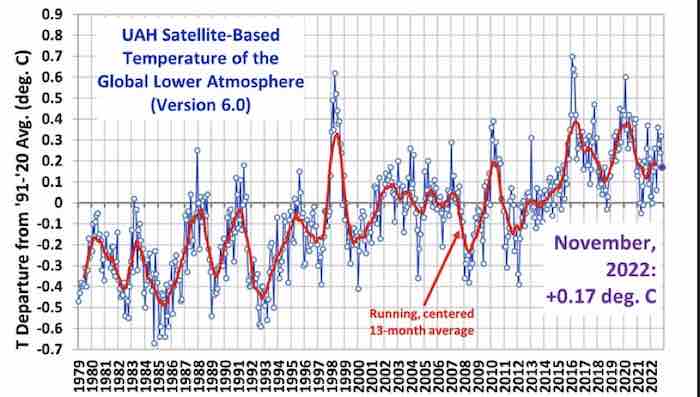
This is the widely accepted Satellite record, and the November drop is obvious. The distinctive highs in 1998 and 2016 are due to the rather strong El Ninos in those years. And that is weather.
Warming out of the Little Ice Age has been due to increasing solar activity and there is a lot of fascinating physics behind this. In the 1990s, solar physicists, Penn and Livingston, determined that the long increase would soon turn to reduced solar activity. And the this has been the case with sunspot activity down to levels last seen in the early 1900s.
Changes in temperature have been greater than can be explained by the variation in energy from the Sun. And the “something” else has been explained as variations in cloud cover. Which in turn has been due to variations in solar activity.
Dr. Henrik Svensmark has published convincing work that diminished solar activity allows more cosmic rays through our atmosphere. Which prompts more cloud cover and cooling. As well as the opposite.
His work includes testing in the huge CERN accelerator in Europe as well as historical observation.
Other climate histories plot temperature and CO2 concentrations over millions of years and there is very little correlation. However, one observation has been that warming trends have preceded increases in CO2. In so many words, heating “causes” increase in CO2.
Not the other way around and the cold November in both hemispheres is due to the general cooling trend. With near-term influences such as the La Nina stubbornly remaining on the cooling side as well as increasing volcanic activity.
Bob Hoye (BobHoye.com) has been researching investments for decades, which eventually included the history of financial and political markets. He considers now to be the most fascinating time for both since the Great Reformation of the 1600s. Bob casts a caustic eye on all promotions and, having a degree in geophysics, is severely critical of the audacity that a committee can “manage” not just the economy, but also the temperature of the nearest planet. He has had articles published in major financial journals and, as a speaker, has amused assemblies in a number of cities, from London to Zurich to Tokyo.


 And then there is an October headline from The Guardian: “Major Sea-Level Rise Caused by Melting of Greenland Ice Cap is ‘Now Inevitable’”. The following chart of Greenland’s Surface Mass Balance of ice shows that accumulation for this season is at the high-side of the standard deviation:
 The next chart is of Snow Cover in Australia and NZ from 2005 to date:
 And Cap Allon in his Electroverse site posted these headlines on December 9th:
“Australia Set Its Coldest-Ever December (Summer)”
“November in the U.S. Was 2 F Below Average, Coldest NW In 4-Decades”
And Cap Allon in his Electroverse site posted these headlines on December 9th:
“Australia Set Its Coldest-Ever December (Summer)”
“November in the U.S. Was 2 F Below Average, Coldest NW In 4-Decades”
 This is the widely accepted Satellite record, and the November drop is obvious. The distinctive highs in 1998 and 2016 are due to the rather strong El Ninos in those years. And that is weather.
Warming out of the Little Ice Age has been due to increasing solar activity and there is a lot of fascinating physics behind this. In the 1990s, solar physicists, Penn and Livingston, determined that the long increase would soon turn to reduced solar activity. And the this has been the case with sunspot activity down to levels last seen in the early 1900s.
Changes in temperature have been greater than can be explained by the variation in energy from the Sun. And the “something” else has been explained as variations in cloud cover. Which in turn has been due to variations in solar activity.
This is the widely accepted Satellite record, and the November drop is obvious. The distinctive highs in 1998 and 2016 are due to the rather strong El Ninos in those years. And that is weather.
Warming out of the Little Ice Age has been due to increasing solar activity and there is a lot of fascinating physics behind this. In the 1990s, solar physicists, Penn and Livingston, determined that the long increase would soon turn to reduced solar activity. And the this has been the case with sunspot activity down to levels last seen in the early 1900s.
Changes in temperature have been greater than can be explained by the variation in energy from the Sun. And the “something” else has been explained as variations in cloud cover. Which in turn has been due to variations in solar activity.
