Overall, the Canadian labour market lost 58,400 jobs in November, more than half in Ontario. The only growth was in Alberta and Saskatchewan.
In this report we present our analysis of the Ontario labour market component of the total Canadian market using two sources of data from Statistics Canada:
CANSIM Table 282-0087, Labour force survey estimates (LFS), by sex and age group, seasonally adjusted and unadjusted monthly, and CANSIM Table 282-0088,
Labour force survey estimates (LFS), employment by North American Industry Classification System (NAICS), seasonally adjusted and unadjusted. Data selection methodology is in the Appendix. The data we use is not seasonally adjusted. Presentation and discussion of the data follows.
The High Level View
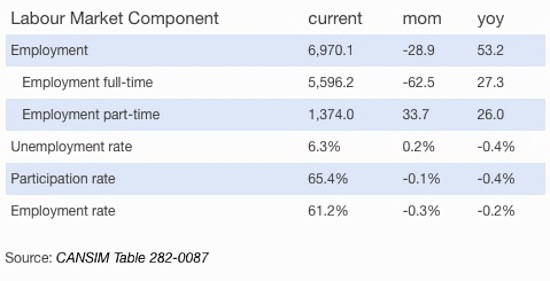
Table 282-0087 shows aggregate labour market statistics for Ontario. We have selected particular stats that we believe reflect on the province’s economic performance, and summarized them in Table 1.
Table 1. Current values and changes in labour market components, month-over-month (mom) and year-over-year (yoy) in thousands unless shown as a percent.

Source:
CANSIM Table 282-0087
Commentary
We consider that the production of goods is the production of wealth while services are largely neutral in terms of wealth creation. Some services such as the accommodation and food services sector destroy wealth.
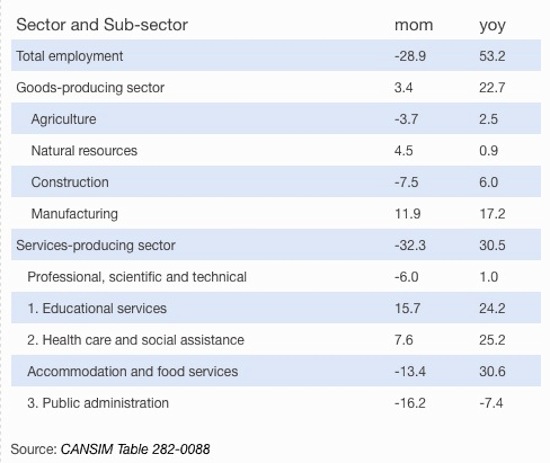
The positive aspect of November job creation was the second strong month of manufacturing job creation with 11,900 jobs and an overall net increase of 3,400 goods-producing jobs.
As we noted in
Blowin’ In The Wind, goods-producing jobs tend to be more highly paid than service-producing jobs by 30% on the average. Without a sectoral wage analysis we suspect that public sector jobs and professional services would provide the higher service wages. The three categories of service jobs that we have numbered in Table 2 are all public sector jobs. With a total yoy increase of 42,000 or 79% of all jobs created, we see that job growth in Ontario has been focused in the public sector. This has strong negative implications for the economic future of Ontario.
Where the Jobs Are in the Economy
Table 282-0088 gives changes in employment by employment category as defined by the North American Industry Classification System. The high level breakdown is by Goods-producing sector and Services-producing sector. We present data in Table 2 below that is selected on the basis of relevance to our narrative or showing anomalous change.
Table 2. Changes in employment in industry sectors and sub-sectors, month-over-month (mom) and year-over-year (yoy) in thousands.

Source:
CANSIM Table 282-0088
Summary
The key points of the November jobs data are:
- Ontario lost 62,500 full-time jobs against a gain of 33,700 part-time jobs;
- the goods-producing sector had a net gain of 3,400 jobs while manufacturing had a strong 11,900 job gain offsetting seasonal agricultural and construction industry job losses;
- the public sector continued to grow, even with a loss of 16,200 government jobs; and
- the annual increase in the combined public sector jobs represents 79% of all jobs created in Ontario over the last year.
The net job losses, particularly those that are full-time, points to a continued deterioration of the Ontario economy. There is a doubly negative aspect of this jobs picture because public sector jobs carry with them, high cost future pension and medical benefit obligations.
Ian Nunn——
Bio and Archives
Ian is a retired information technologist. While working at Health Canada he completed a BCS degree with highest honours at Carleton University in 1999. In 1998 he took a leave of absence from the federal government and worked as a consultant to Ontario Hydro Nuclear for 15 months in Y2K risk management. He retired from the government in 2000, went on to earn an MCS degree at Carleton, 2002, and subsequently completed the requirements for a PhD except for a dissertation.
Several years of graduate studies have equipped him to do thorough background research and analysis on topics he finds engaging. He is owner of the eclectic blog, The POOG. The acronym “POOG” came from a forgotten source: “pissed-off old guy”. A web search found a more flattering but accurate association: ”The mightiest of all men. He fights ignorant darkness in the name of wisdom, truth, courage, and honor.”
Ian lives in Ottawa.
 Source: CANSIM Table 282-0087
 Source: CANSIM Table 282-0088