

By Ian Nunn ——Bio and Archives--January 6, 2015
Global Warming-Energy-Environment | CFP Comments | Subscribe | Email Us


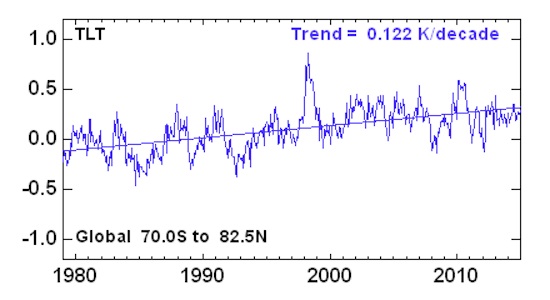 A linear regression trend line for the data shows a slight warming trend (0.122 K/decade). The problem with this analysis is that there is no justification for a linear curve to fit the data apart from mathematical convenience. Indeed it is widely acknowledged that there is a 'hiatus' in the warming trend as shown in Figure 2, going back to the early to mid 1990s. A linear trend must also cause problems for those who wish to attribute the warming to anthropogenic CO2 sources since its increase is greater than linear as noted by CO2Now.org:
The concentrations of CO2 in the atmosphere are increasing at an accelerating rate from decade to decade. The latest atmospheric CO2 data is consistent with a continuation of this long-standing trend.
And there is no 'hiatus' in CO2 production.
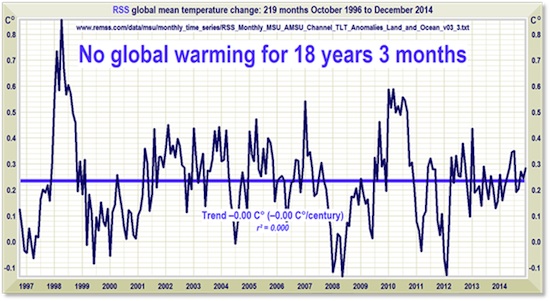
Figure 2. A linear regression trend line drawn on the data from Figure 1 for the period 1997 t0 2015
A linear regression trend line for the data shows a slight warming trend (0.122 K/decade). The problem with this analysis is that there is no justification for a linear curve to fit the data apart from mathematical convenience. Indeed it is widely acknowledged that there is a 'hiatus' in the warming trend as shown in Figure 2, going back to the early to mid 1990s. A linear trend must also cause problems for those who wish to attribute the warming to anthropogenic CO2 sources since its increase is greater than linear as noted by CO2Now.org:
The concentrations of CO2 in the atmosphere are increasing at an accelerating rate from decade to decade. The latest atmospheric CO2 data is consistent with a continuation of this long-standing trend.
And there is no 'hiatus' in CO2 production.
Figure 2. A linear regression trend line drawn on the data from Figure 1 for the period 1997 t0 2015
 Source: Watts Up With That? and Remote Sensing Systems.
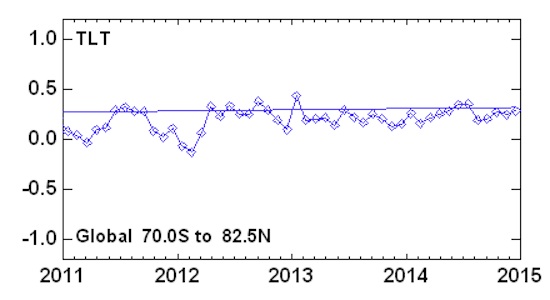
But we digress slightly. What we want is to know where 2014 temperatures fall with respect to the recent past. As we can see from Figure 3, they are certainly not as high as others in the recent past although the year end was higher.
Figure 3.
Source: Watts Up With That? and Remote Sensing Systems.
But we digress slightly. What we want is to know where 2014 temperatures fall with respect to the recent past. As we can see from Figure 3, they are certainly not as high as others in the recent past although the year end was higher.
Figure 3.
 Source: Remote Sensing Systems recent history.
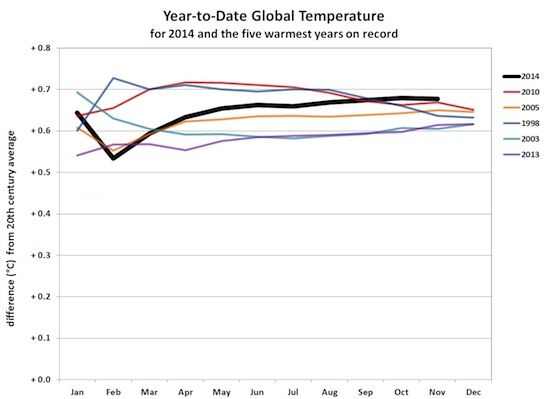
To get a better picture of 2014 in its entirety in comparison to other years that exhibited high temperatures we go to NOAA's National Climatic Data Center. The 6 warmest years on record are shown in Figure 4. The only way to compare them accurately is to integrate the area under each of the curves. However, by inspection, 2014 had the coldest February of the 6 and the warmest final quarter of the six. Clearly 1998 and 2010 were warmer overall as is easily seen by the distance between the black line (2014) and the dark blue (1998) and red (2010) lines.
Figure 4. The temperature anomalies associated with the 6 warmest years on record.
Source: Remote Sensing Systems recent history.
To get a better picture of 2014 in its entirety in comparison to other years that exhibited high temperatures we go to NOAA's National Climatic Data Center. The 6 warmest years on record are shown in Figure 4. The only way to compare them accurately is to integrate the area under each of the curves. However, by inspection, 2014 had the coldest February of the 6 and the warmest final quarter of the six. Clearly 1998 and 2010 were warmer overall as is easily seen by the distance between the black line (2014) and the dark blue (1998) and red (2010) lines.
Figure 4. The temperature anomalies associated with the 6 warmest years on record.
 Source: NOAA: State of the Climate, November 2014.
It confounds us given this data, that NOAA can say:
The first 11 months of 2014 was the warmest such period on record, with a combined global land and ocean average surface temperature of 1.22°F (0.68°C) above the 20th century average of 57.0°F (13.9°C), surpassing the previous record set in 2010 by 0.02°F (0.01°C).
Source: NOAA: State of the Climate, November 2014.
It confounds us given this data, that NOAA can say:
The first 11 months of 2014 was the warmest such period on record, with a combined global land and ocean average surface temperature of 1.22°F (0.68°C) above the 20th century average of 57.0°F (13.9°C), surpassing the previous record set in 2010 by 0.02°F (0.01°C).
View Comments
Ian is a retired information technologist. While working at Health Canada he completed a BCS degree with highest honours at Carleton University in 1999. In 1998 he took a leave of absence from the federal government and worked as a consultant to Ontario Hydro Nuclear for 15 months in Y2K risk management. He retired from the government in 2000, went on to earn an MCS degree at Carleton, 2002, and subsequently completed the requirements for a PhD except for a dissertation.
Several years of graduate studies have equipped him to do thorough background research and analysis on topics he finds engaging. He is owner of the eclectic blog, The POOG. The acronym “POOG” came from a forgotten source: “pissed-off old guy”. A web search found a more flattering but accurate association: ”The mightiest of all men. He fights ignorant darkness in the name of wisdom, truth, courage, and honor.”
Ian lives in Ottawa.