
By Tom Harris ——Bio and Archives--February 24, 2024
Global Warming-Energy-Environment | CFP Comments | Reader Friendly | Subscribe | Email Us
Over the past few decades, one of the greatest mystery stories in the history of science has played out—trying to understand why changes in the output of the Sun, not human emissions of greenhouse gases, appears to be the primary driver of climate change on Earth.
For example, it was during a period of high solar activity around 1000 AD when we experienced the Medieval Warm Period when the great cathedrals were built in Europe and the Vikings settled Greenland where they raised sheep and grew grain. And it was during a period of low solar activity that the Little Ice Age occurred between about 1300 and 1850, at the start of which the Viking Greenland colonies died out.
Climate Series:
Of course, humanity’s emissions of carbon dioxide and other infrared-absorbing gases was trivial during both of those time periods, so it is important to understand what natural forces caused such climatic swings and determine if those factors are still the main drivers of climate change today.
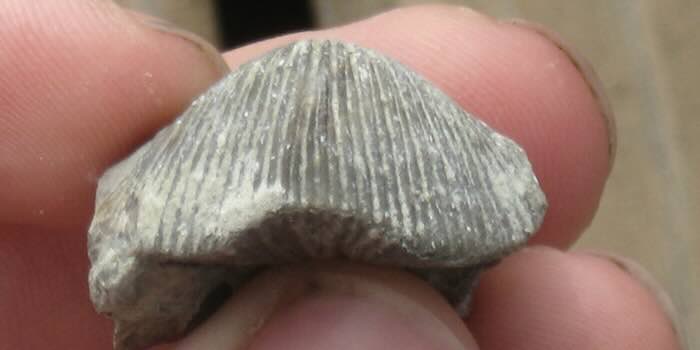
As my guest Dr. Ian Clark explained in “Earth Scientists… The sun drives climate change!”— the January 29, 2024 episode of my The Other Side of the Story podcast—one of the most influential players in the detective story that helped us answer this question was Professor Jan Veizer, the Distinguished University Professor (emeritus) of Earth Sciences at the University of Ottawa and Institute for Geology, Mineralogy and Geophysics of Bochum Ruhr University in Germany. By analyzing oxygen isotopes in fossilized seashells, in particular the fossils of brachiopods (see photograph above), Dr. Veiser discovered that the Earth warmed and cooled periodically on time scales of tens of millions of years throughout the Phanerozoic, the geologic eon that covers the time period from about 600 million years ago to the present.
Here is how he found that.
The oxygen atom always has eight protons, hence an atomic number of eight—which defines it as oxygen in the periodic table (below)—and usually eight neutrons, giving it a “mass number” of 16, the sum of the number of protons and neutrons. This is called O-16. However, one “isotope” of oxygen has ten neutrons, giving it a mass number of 18. This is called O-18.
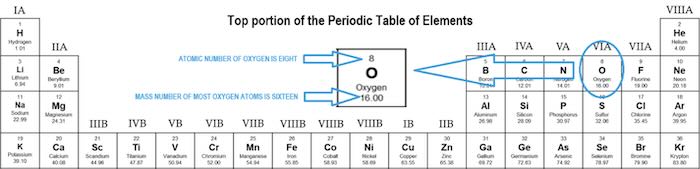
In the ocean, most of the oxygen in the sea water, H2O, is O-16, with only a small fraction of it being O-18. While the fraction that is O-18 varies with salinity, temperature and evaporation effects, the natural abundance of O-18 in sea water is typically only 0.2%, meaning that for every 1,000 oxygen atoms in the water, about two of them are O-18.
Because the water molecule, H2O, made from O-16 is obviously lighter than that made from O-18, water with O-16 preferentially evaporates over the heavier water with O-18. In warm periods, much of this water falls as rain on the land and then flows back into the sea, maintaining the O-18 to O-16 ratio in the ocean. However, in glacial periods when far more of the land surface of Earth is covered with permanent ice and snow, more of the water evaporated from the oceans falls as snow and stays on the land, thereby measurably increasing the O-18 to O-16 ratio, often referred to as , in seawater.
Hard shelled sea animals build their shells with the materials from the environment in which they live of course, including the surrounding seawater. Therefore, during glacial periods, when in the water is higher than during warm times, their shells will reflect this higher ratio. During warm times, the O-18 to O-16 ratio in their shells would naturally be lower, indicating the different environment in which they live. This ratio is preserved in fossilized seashells.
Support Canada Free Press
Professor Clark explained in the January 29th interview:
[note: O-16 and O-18 are both stable isotopes, making them ideal for this method, in contrast with unstable isotopes such as O-15, O-19, and other oxygen isotopes which are radioactive and decay into other elements over time]
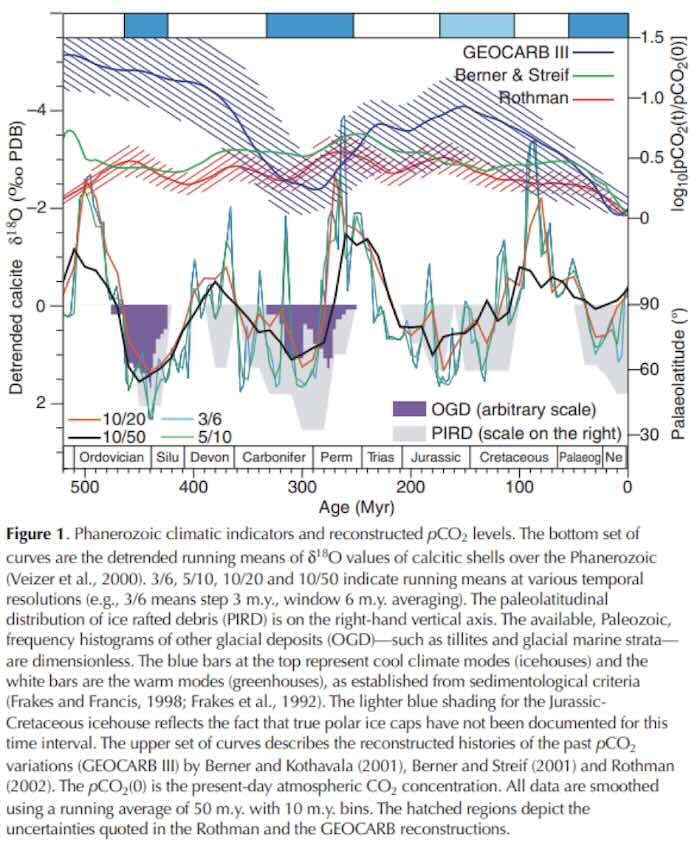
This method reveals when there was more or less land glaciation, a proxy for temperature, over the approximately 600 million years that there has been hard shelled sea creatures. And what Veizer found was astonishing: there was a nearly sinusoidal variation of and so the implied temperature over this time frame, as shown below, Figure 1 from the blockbuster 2003 paper, Celestial Driver of Phanerozoic Climate. The black nearly sinusoidal line in the figure shows the variation in , a direct indicator of temperature. The other colored lines around the black line are simply curves showing different averaging and resolution computations of the same data. Note that the vertical axis on the left is inverted, so high , approaching 2 units below the x-axis at about 450 million years ago, indicates an “icehouse” period, highlighted by the dark blue bar at the top of the graph, a time frame far colder and of greater duration than recent ice ages.
The top three curves of Figure 1, which are different determinations of CO2 in the past, GEOCARB III—in purple, Berner & Streif—in dark green and Rothman—in red, also illustrates that there is no meaningful, consistent correlation between temperature and CO2 levels in the past 500 million years. Note that CO2 levels are plotted as a logarithm, base 10, of the ratio of the level of CO2 at some time in the past to its level today (t = 0), meaning that the curve goes to zero in the present as the logarithm of one is zero. Also note that, when we were at the coldest period in the past half billion years about 450 million years ago, CO2 levels were considerably higher than today, thereby refuting the assumption that CO2 concentration has been the dominant driver of temperature over all time frames. See the caption below figure 1 for more information about this graph.
So, if it was not variations in CO2 concentration, what could have caused such temperature changes over time frames of tens of millions of years, detective professor Jan Veiser wondered. In next week’s article, I will show how Veiser answered this mystery and demonstrate why this discovery has helped revolutionize our understanding of what really drives climate change on all time scales. Stay tuned!

View Comments
Tom Harris is Executive Director of the Ottawa, Canada-based International Climate Science Coalition at http://www.icsc-climate.com.