
By Tom Harris ——Bio and Archives--March 3, 2024
Global Warming-Energy-Environment | CFP Comments | Reader Friendly | Subscribe | Email Us

Scientists have known for a long time that solar activity correlates well with climatic conditions on Earth. This should surprise no one since our home star is an enormous source of energy, only a tiny fraction of which is intercepted by the Earth. Yet that is enough to raise the temperature of our planet from near absolute zero to the relatively comfortable 15o C we enjoy today.
Climate Series:
The fact that, in 2004, Prof. Dr. Sami K. Solanki, now of the Max Planck Institute for Solar System Research, et al, found that the Sun had been more active during the previous 70 years than it had been in more than 8,000 years, should obviously have some bearing on the warming of the late 1990s. Dr. Henrik Svensmark, physicist and professor in the Division of Solar System Physics at the Danish National Space Institute in Copenhagen stated:
The problem was, the direct impact of changes in solar insolation, the solar radiation that reaches the Earth’s surface, was too small to account for warming observed since the start of the Industrial Revolution. For example, the Total Solar Irradiance, the amount of solar energy reaching the top of Earth’s atmosphere, only varies by about 0.1% over the course of the familiar 11-year sunspot cycle. While the variations can be greater for longer cycles, for example the 200-year solar cycle, they are still insufficient to account for the observed warming, at least via direct solar insolation changes. This is why the United Nations dismisses the Sun as a candidate for the major cause of warming over the past few centuries. After all, we have no control of the Sun, of course, so the IPCC pays no attention to sunspots, an important gauge of solar activity. Instead they point to humanity’s carbon dioxide (CO2) emissions as the primary driver.
However, as I discussed in “Climate ‘detective story’ upends politically correct science,” my previous article in this series, geologists have found that CO2 and temperature do not show any consistent correlation over geologic time. As seen in the graph I included last week, below, at times, CO2 levels were remarkably high, and temperatures were moderate or even low. At other times, CO2 was low, and temperatures were high. And sometimes they were both high or low at the same time.
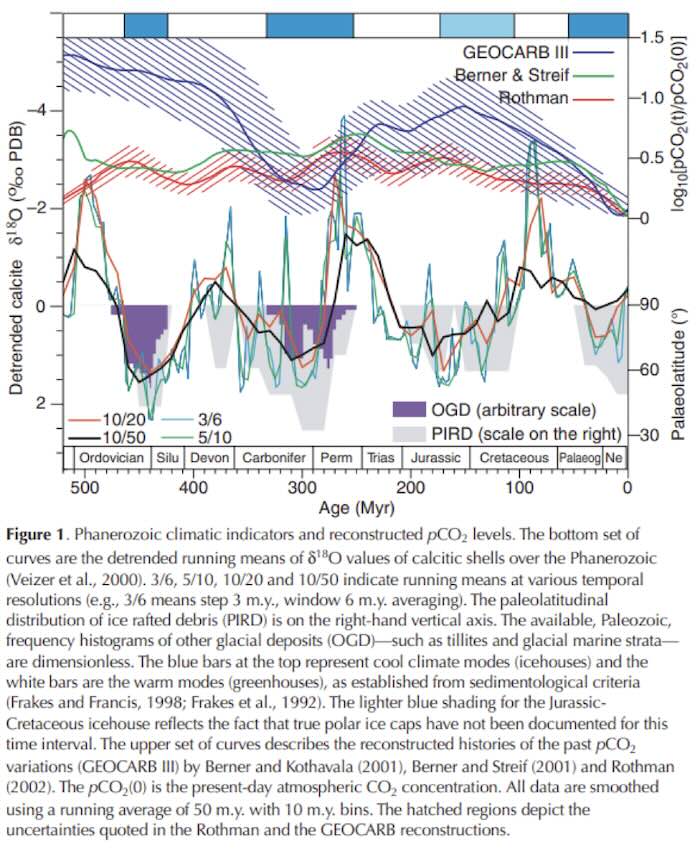
As explained in the caption to this important image, the changes in (see part one of this series), a proxy for temperature variations, were determined by Dr. Jan Veizer, the Distinguished University Professor (emeritus) of Earth Sciences at the University of Ottawa and Institute for Geology, Mineralogy and Geophysics of Bochum Ruhr University in Germany. Veizer was surprised to note that the Earth warmed and cooled periodically, switching back and forth between ice house and hot house, following an approximately sinusoidal pattern with a periodicity of about 140 million years throughout the Phanerozoic, the geologic eon that covers the time period from about 600 million years ago to the present.
Support Canada Free Press
In the documentary, The Cloud Mystery, Dr. Veizer, said:
But then one evening, Professor Veizer received an e-mail from Professor Nir Shaviv of the Hebrew University of Jerusalem in which Shaviv said that he might have an explanation for the periodic temperature changes Veizer had observed over the Phanerozoic.
Shaviv explained that he had been working with galactic cosmic ray (GCR) flux, or variation, over the same time interval and that that variability has a periodicity similar to that which Veizer had found in temperature. GCRs are high energy particles that originate in supernovas in deep space, eventually flooding into our solar system. Shaviv was able to determine GCR flux by analyzing iron meteorites that originally broke off of asteroids millions of years ago and so became exposed to GCRs and then recorded evidence of GCR flux over vast time periods.
Laying Veizer’s Phanerozoic temperature curve over Shaviv’s GCR curve revealed the following, as published in the 2003 paper, Celestial Driver of Phanerozoic Climate by Shaviv and Veizer:
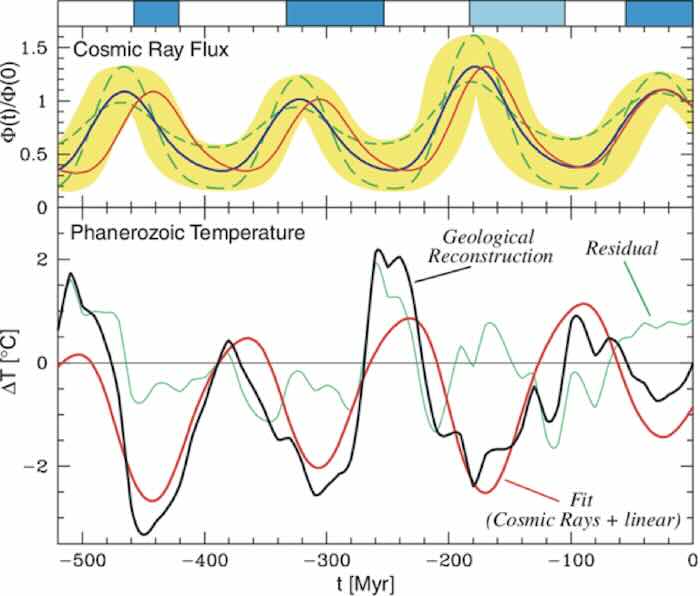
The curves to pay attention to in the above figure are:
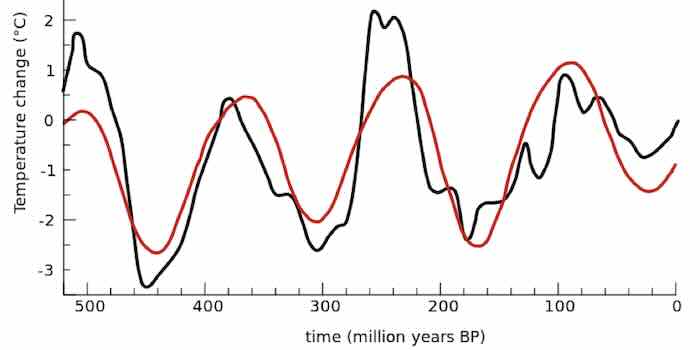
Note how closely the lower black curve (the temperature history as determined by fossils) and the red curve (the forecast GCR-induced temperature change) coincide in both periodicity and magnitude. For simplicity, here are those two curves on their own:

So how does the influx of GCR cause temperature change? Here is the theory, which, as I will explain in part 3 of this series, is supported by experimentation:
As the GCRs penetrate the Earth’s atmosphere, they encourage the formation of particles in the lower atmosphere which are referred to as condensation nuclei. These are particles around which a microscopic form of liquid water forms, causing clouds. It takes about a million of these particles to form a moderate-sized raindrop. Low level clouds act like a screen in a greenhouse controlling the temperature, so when there are more clouds, the Earth cools.
And what could cause GCR flux variations with a periodicity of 140 million years? It is our movement in and out of the Milky Way Galaxy’s spiral arms and other stellar ‘density waves,’ which cause varying amounts of cloud-causing GCRs as our distance to young supernovas stars varies.
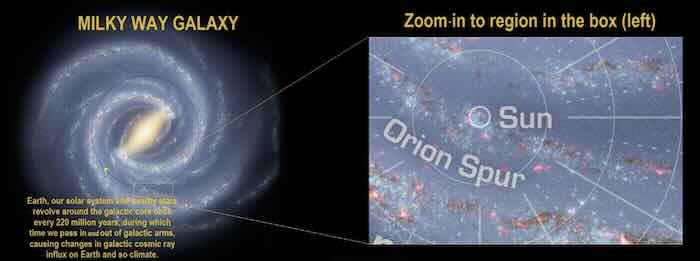
So, it is our position in our home galaxy, specifically our proximity to GCR-producing supernovas, that ultimate determines massive, very long-term changes in Earth’s climate.
This is fascinating, of course, but climate campaigners complain that such long-term phenomena have nothing to do with climate change over the past century. But they are wrong. It has everything to do with climate change today.
Next week, I will explain why, and how, the Sun, through its impact on the GCR flux that we experience on Earth, appears to be the most important short and medium-term driver of climate change. Carbon dioxide emissions have little impact on our planet’s climate.
View Comments
Tom Harris is Executive Director of the Ottawa, Canada-based International Climate Science Coalition at http://www.icsc-climate.com.