By Sierra Rayne ——Bio and Archives--December 24, 2014
Global Warming-Energy-Environment | CFP Comments | Reader Friendly | Subscribe | Email Us
"It's already getting hotter on B.C.'s local ski hills. According to a City of North Vancouver report from September 2013, the minimum January temperature at Grouse Mountain increased at a rate of 0.8 C per decade between 1951 and 2000. A continuation of this historical trend would see winter temperatures rise to their warmest modelled scenario, approximately 2.7 degrees higher by 2050."Heading for the source on this piece from The Tyee, I found the City of North Vancouver report in question. If I was a taxpayer in this city, I would not be happy with the quality of this report. Problems abound. Take this paragraph from the city's climate change report:
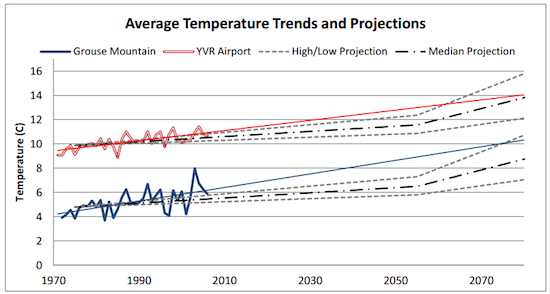
"Between 1951 and 2000, average temperatures increased by 1.0 C at YVR Airport (0.2 C/decade), with further increases of 1.7 C and 2.7 C projected for the region by 2050 and 2080, respectively. However, at Grouse Mountain the average temperature is increasing at twice that rate, +0.4 C/decade, summer high temperatures at +0.7 C/decade, and January low temperatures at +0.8 C/decade (Table 1). At Vancouver Harbour the average and summer high temperatures are increasing at a rate similar to or slightly faster than at YVR, but the January low temperatures are increasing much faster, at 0.7 C/decade. These historical rates of change are already outpacing the climate model projections, particularly at Grouse Mountain where continuing at the historical trend would see temperatures near or above the warmest model scenarios (Figure 2)."Nope. First off, there is no Table 1 in the report, and the Figure 2 being referred to is a map of the climate station locations -- not a figure of climate trends and projections. Clearly we are not off to a promising start. The report then shows this figure of "Historical trends in annual mean temperature at YVR Airport and Grouse Mountain" with data obtained from "Environment Canada's National Climate Data and Information Archive."
 That looks to be a nearly -- if not entirely -- continuous series of average annual temperatures at Grouse Mountain between 1972 and 2006. Of course, when I downloaded the raw climate data for Grouse Mountain direct from Environment Canada, there were incomplete records (i.e., months with no data) for the following years: 1982, 1983, 1997, 1998, 2000, 2001, 2002, 2003, and 2004.
In other words, the historical climate record for Grouse Mountain since 1972 has some major holes in it, and average annual temperatures cannot likely be reliably calculated for the years listed above. Of note, records only begin at the site in October 1971, not 1951 as the municipal report suggests and which The Tyee's article explicitly -- and erroneously -- claims.
Here is where the narrative appears to take on a ridiculous turn. See that extremely hot year for 2003 in the City of North Vancouver's plot above? The year with an average annual temperature of 8 C? Well, the Environment Canada database only has monthly temperatures available for April, May, July, and December of that year in their dataset. The other eight months for 2003 all have missing data. And when you take the average of these four months, you obtain an average of 8 C.
Did the City of North Vancouver not screen the raw dataset for missing months when calculating annual averages? Sure enough, when I took the averages of all years between 1972 and 2006 -- whether or not the years had complete monthly data or not -- I obtained a chart that exactly matched what this municipality published and then fit a trendline through.
It is hard to believe work like this is published and then repeated uncritically in the media.
Repeat after me: you need a complete set of monthly data (i.e., all 12 months) in order to calculate an annual average temperature. Do not do what the City of North Vancouver apparently did -- it is complete scientific nonsense.
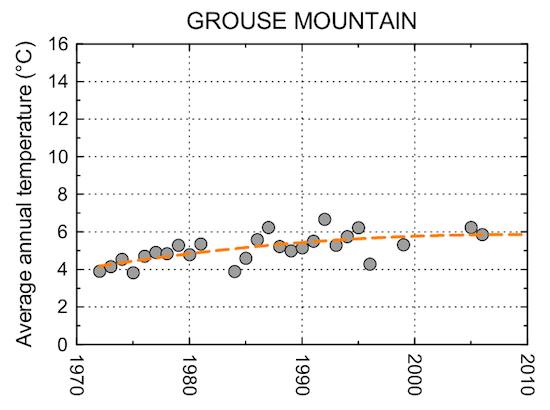
So here is what the data series for Grouse Mountain looks like using only the years with complete data (the scale has been left at 0 to 16 C to allow direct comparison with the City of North Vancouver's chart).
 Quite a difference between the reality of this chart, and the fantasy of the City of North Vancouver's chart. Using more appropriate line fitting as well shows clearly that the temperature increase at Grouse Mountain has progressively slowed down since the 1970s and is now flatlining -- suggesting it is not going to reach much, if any, above its current value of 6 C. It may even decline in the near future.
And about that claim in The Tyee that "the minimum January temperature at Grouse Mountain increased at a rate of 0.8 C per decade between 1951 and 2000." As noted above, the site's data doesn't even start until October 1971, and all of that supposedly increasing trend in the minimum January temperature took place between 1972 and 1978. Over the last three decades of the available record (i.e., 1978 through 2007), there is no sign of a significant trend (p-value=0.62). The trendline is pretty much flat.
Overall, the City of North Vancouver -- and The Tyee -- need to start again from first principles, work the data correctly up from scratch and re-analyze it, and then republish some new reports and articles that accurately convey what is happening on Grouse Mountain.
Quite a difference between the reality of this chart, and the fantasy of the City of North Vancouver's chart. Using more appropriate line fitting as well shows clearly that the temperature increase at Grouse Mountain has progressively slowed down since the 1970s and is now flatlining -- suggesting it is not going to reach much, if any, above its current value of 6 C. It may even decline in the near future.
And about that claim in The Tyee that "the minimum January temperature at Grouse Mountain increased at a rate of 0.8 C per decade between 1951 and 2000." As noted above, the site's data doesn't even start until October 1971, and all of that supposedly increasing trend in the minimum January temperature took place between 1972 and 1978. Over the last three decades of the available record (i.e., 1978 through 2007), there is no sign of a significant trend (p-value=0.62). The trendline is pretty much flat.
Overall, the City of North Vancouver -- and The Tyee -- need to start again from first principles, work the data correctly up from scratch and re-analyze it, and then republish some new reports and articles that accurately convey what is happening on Grouse Mountain.View Comments
Sierra Rayne holds a Ph.D. in Chemistry and writes regularly on environment, energy, and national security topics. He can be found on Twitter at @srayne_ca