By Dr. Klaus L.E. Kaiser ——Bio and Archives--January 28, 2015
Global Warming-Energy-Environment | CFP Comments | Reader Friendly | Subscribe | Email Us
 More recently, the U.S. as well as Russia are in the early stage of modernizing their nuclear arsenals. Other countries currently in possession of nuclear bombs may follow suit and yet others are in the process of developing such capabilities. Altogether good reason to adjust the DC closer to midnight.
While the nuclear threat has increased since the DC’s longest interval of 17 min to midnight in 1991, simply due to the number of countries in possession of such powerful bombs, their actual total number in the world has steadily declined over the last three decades. This is largely a result of the Strategic Arms Limitation Treaty (SALT) between the United States and the Soviet Union signed in 1972 and related treaties, widely known under the term “Megatons to Megawatts.”
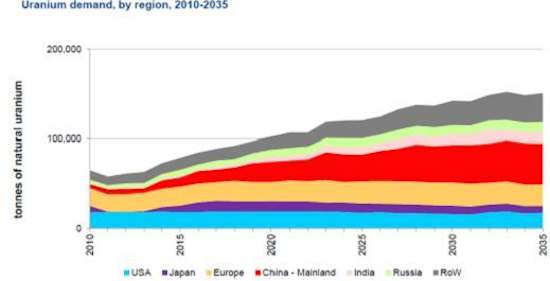
Since then, an estimated 20,000 former war heads and precursor material have been dismantled and their uranium is still being used to generate electricity in nuclear power plants. However that secondary supply of fissionable uranium is eventually running out and demand from power plants is expected to keep rising for the next two decades as shown below (A-Cap Resources Ltd.):
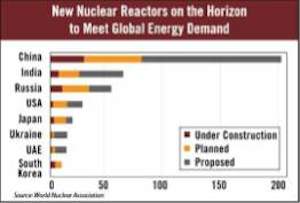
 Most of that new demand is expected to come from nuclear power plants. Worldwide, their current number is 450 or so, not all in operation. Another 100 plants are currently being planned or under construction and a further 200 are to follow much later. The distribution of these new plants is shown in the graph below (www.world-nuclear.org).
 It should also be noted that not all nuclear power plants are equal. There are several basic technologies in use, some of which create fissionable (bomb-material) byproducts and other that do not. Also, operational safety controls and potential damage from natural events varies strongly. Overall, however, nuclear power plants have been extremely reliable and safe. Worldwide they now provide approximately 400,000 MW of electric energy or less than 1% of all electricity consumption of 21x10^ GWh/year. In many western countries this percentage is much higher, more in the order of 20+%.
Now back to the clock and the first (major?) reason for the change in time – would you have guessed it? – the politically-correct all-around-standby reason for anything: climate change.
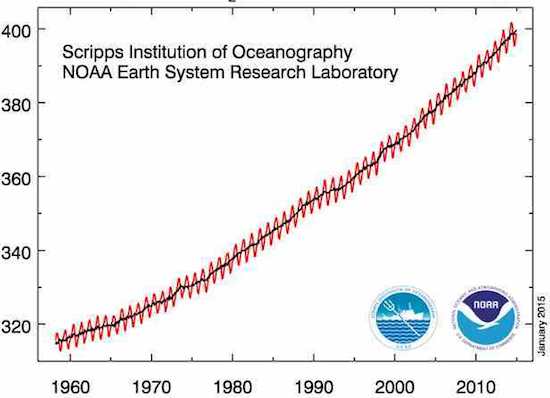
 If you can see any correlation between these two graphs, please send me a note explaining it.
Frankly, I never can decide whether I should laugh or cry at all the claims about climate change one can find. There is a website (Numberwatch.co.uk; no longer updated for several years now) that lists all the effects having been ascribed to “climate change” or “global warming” as it was called then. It still is a hilarious read and includes things like the Loch Ness Monster, marital infidelity and other obvious effects.
Don’t you think the current “order of the day” of blaming nearly everything under the sun on climate change or carbon dioxide is a bit over the top?
If you can see any correlation between these two graphs, please send me a note explaining it.
Frankly, I never can decide whether I should laugh or cry at all the claims about climate change one can find. There is a website (Numberwatch.co.uk; no longer updated for several years now) that lists all the effects having been ascribed to “climate change” or “global warming” as it was called then. It still is a hilarious read and includes things like the Loch Ness Monster, marital infidelity and other obvious effects.
Don’t you think the current “order of the day” of blaming nearly everything under the sun on climate change or carbon dioxide is a bit over the top?View Comments
Dr. Klaus L.E. Kaiser is author of CONVENIENT MYTHS, the green revolution – perceptions, politics, and facts Convenient Myths